| month | chemical_code | chemical | total_items | items_per_wd |
|---|---|---|---|---|
| 2016 May | 1001010AH | Celecoxib | 23402 | 975.0833 |
| 2016 Jun | 1001010AH | Celecoxib | 24261 | 933.1154 |
| 2016 Jul | 1001010AH | Celecoxib | 23610 | 908.0769 |
| 2016 Aug | 1001010AH | Celecoxib | 23997 | 922.9615 |
| 2016 Sep | 1001010AH | Celecoxib | 23962 | 921.6154 |
Seasonality Detection Pipeline - Test
Data
The following medications (depot antipsychotics, NSAIDs, and Contraceptives) were used to test the pipline and the results displayed here:
- Flupentixol (0402020G0)
- Paliperidone (0402020AB)
- Zuclopenthixol (0402020Z0)
- Norethisterone (0604012P0)
- Celecoxib (1001010AH)
The data used spans exactly 120 months (10 years).
Full Pipeline
Putting it all together.
Aggregation and Visualisation
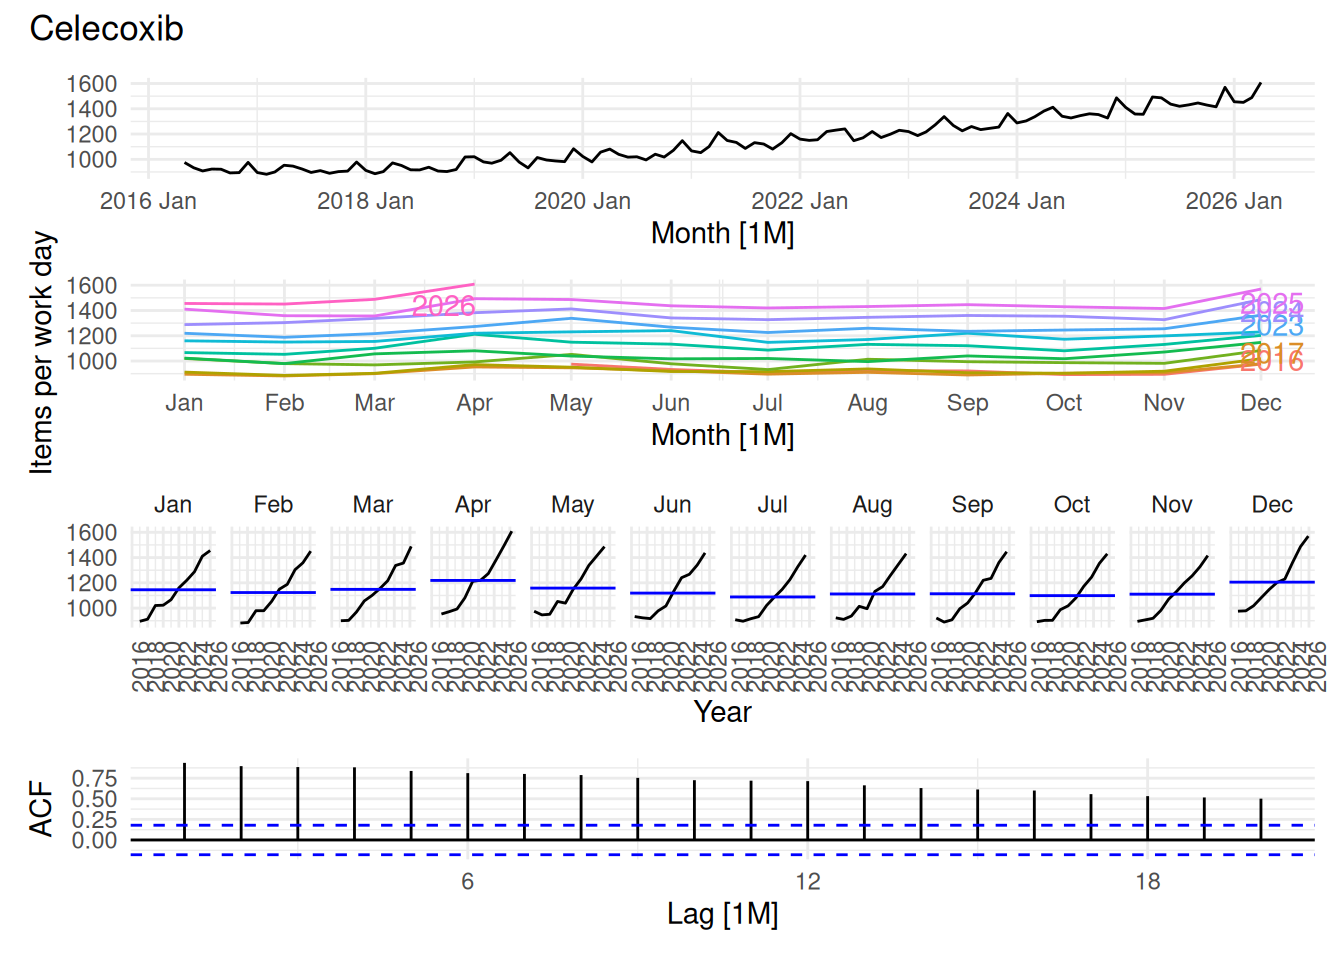
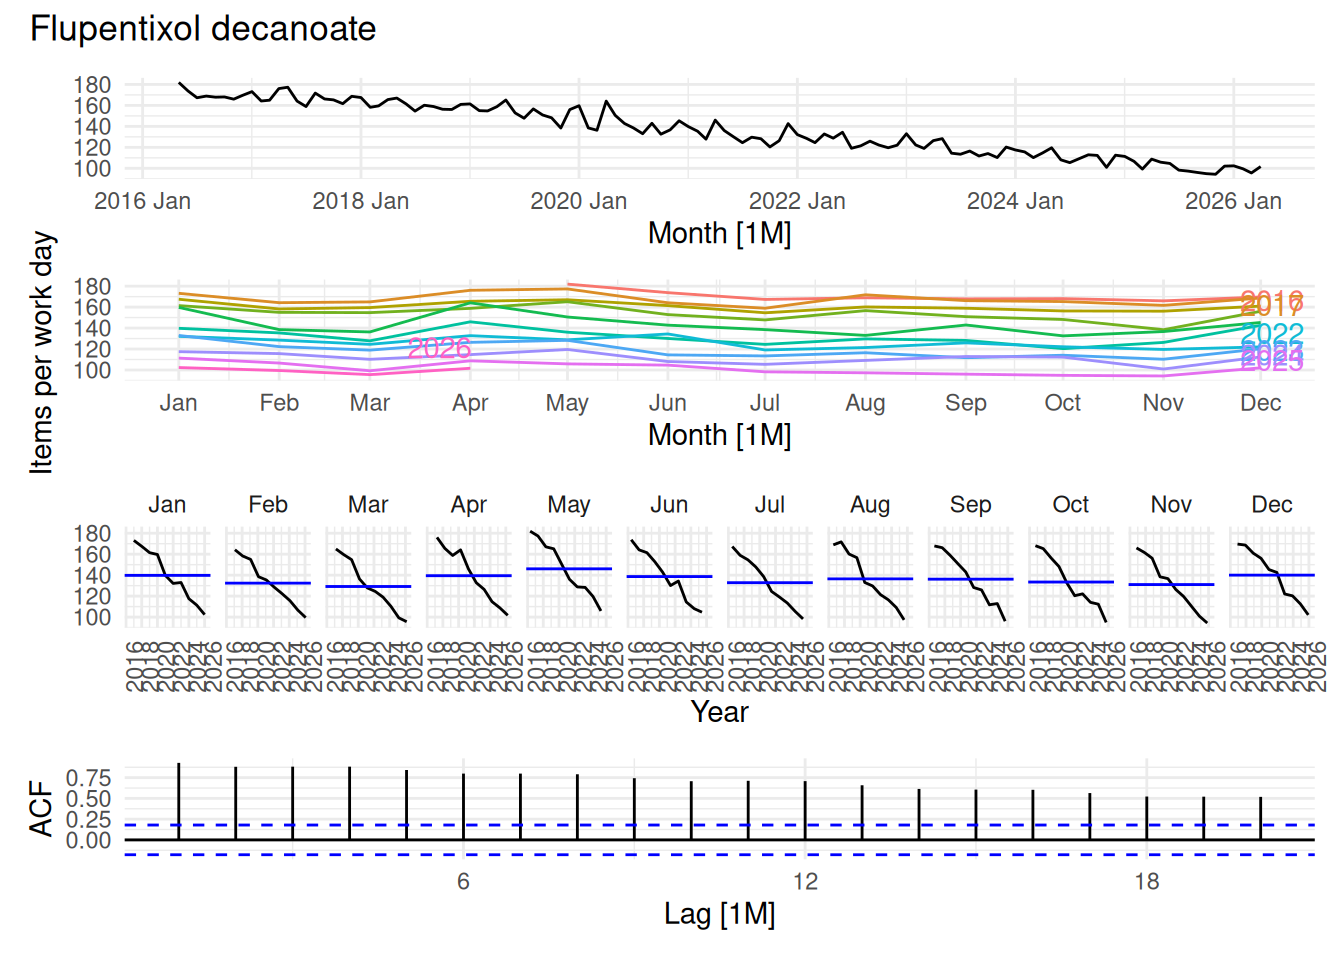
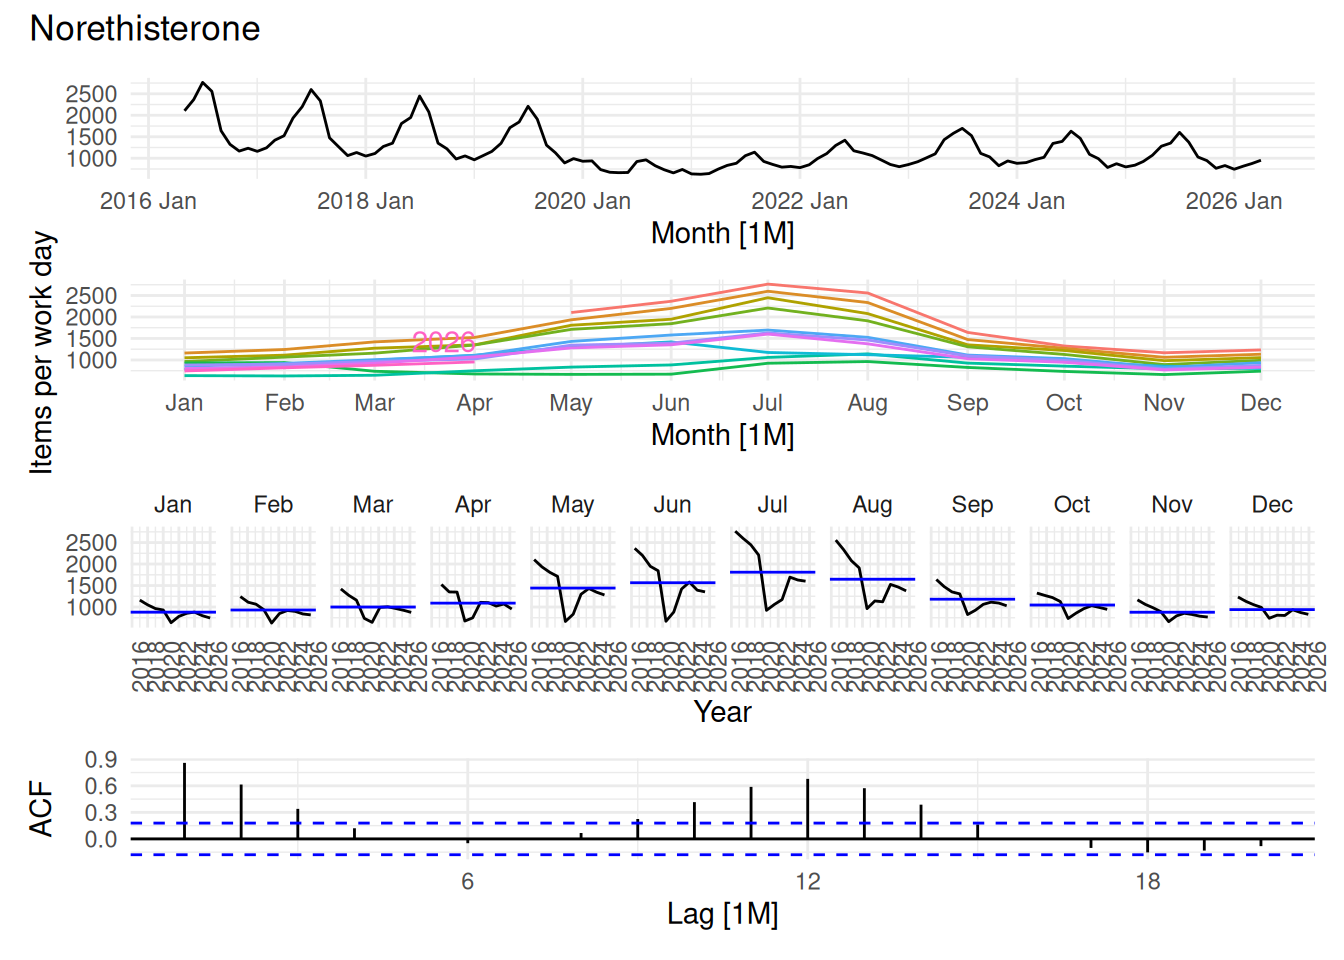
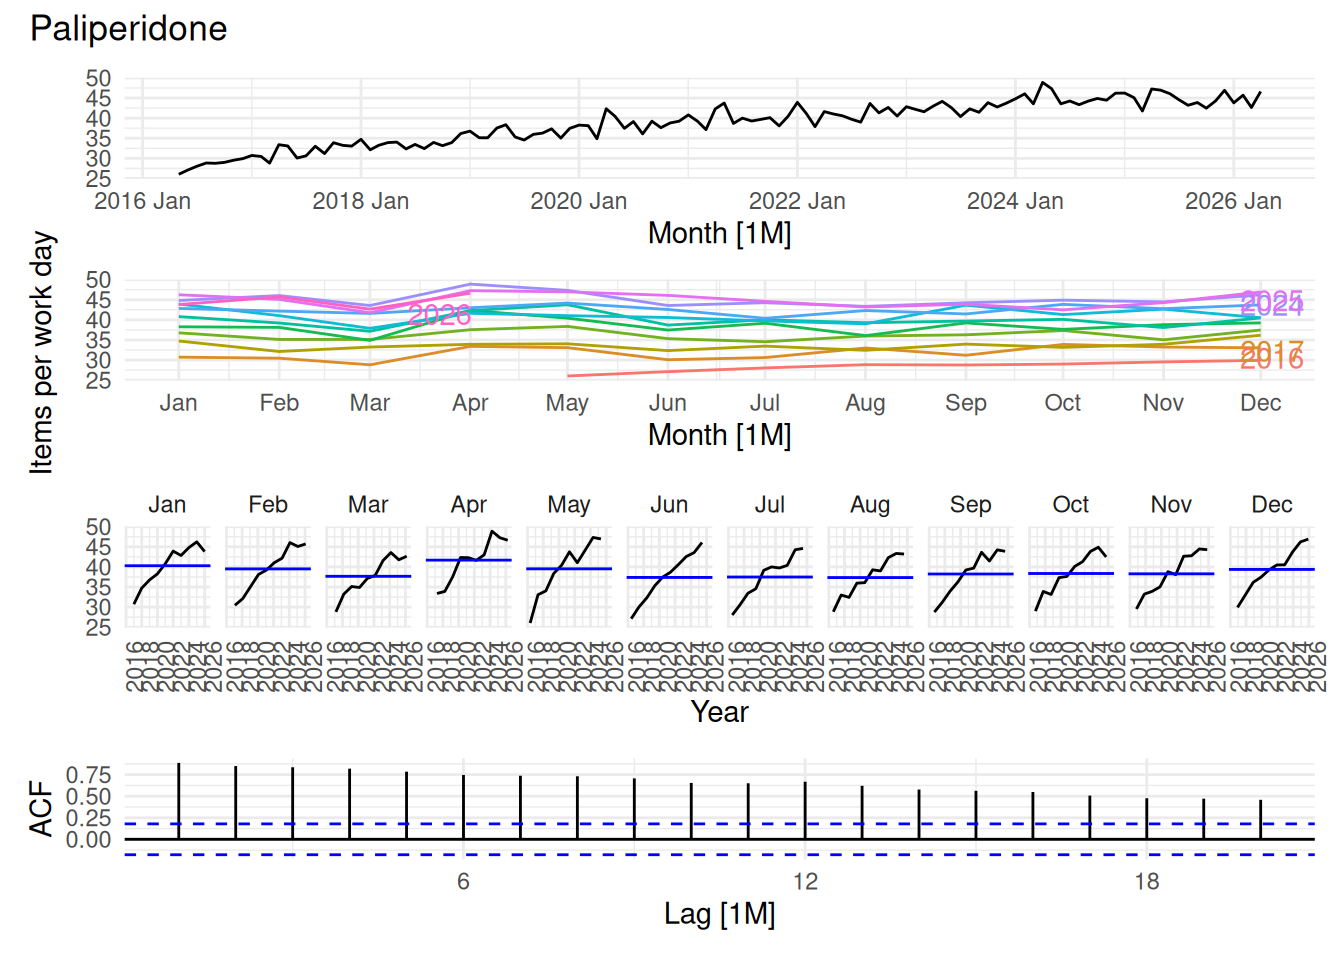
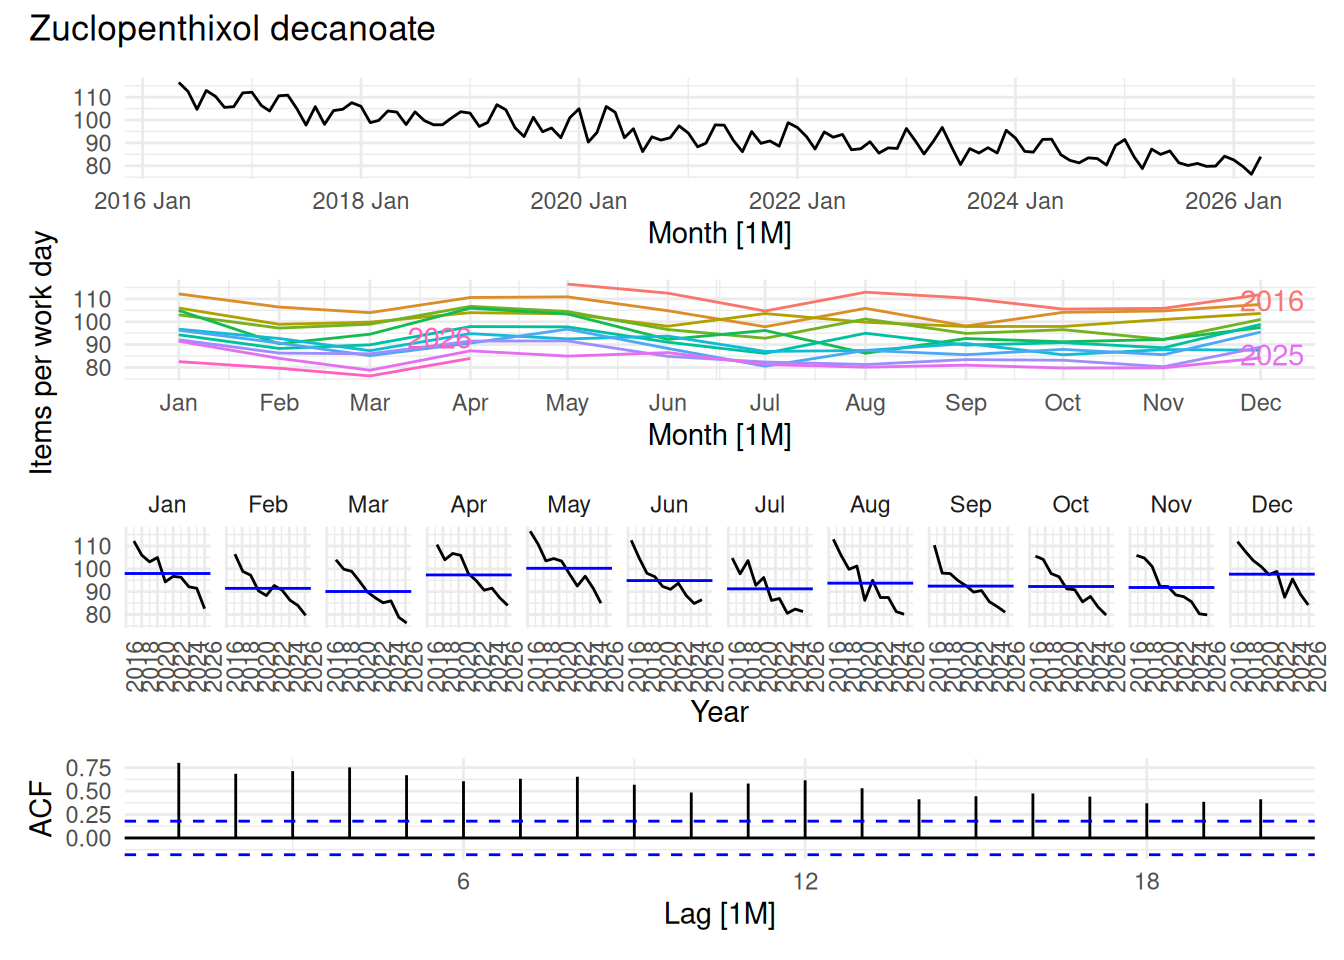
Detrending
Strengh scores
feasts::feat_stl()
| chemical_code | chemical | trend_strength | seasonal_strength_year | seasonal_peak | seasonal_trough |
|---|---|---|---|---|---|
| 0402020AB | Paliperidone | 0.9659775 | 0.5871504 | May | Apr |
| 0402020G0 | Flupentixol decanoate | 0.9833602 | 0.6805966 | May | Aug |
| 0402020Z0 | Zuclopenthixol decanoate | 0.9341716 | 0.6808777 | May | Aug |
| 0604012P0 | Norethisterone | 0.8373827 | 0.8430327 | Aug | Dec |
| 1001010AH | Celecoxib | 0.9900935 | 0.7691739 | May | Nov |
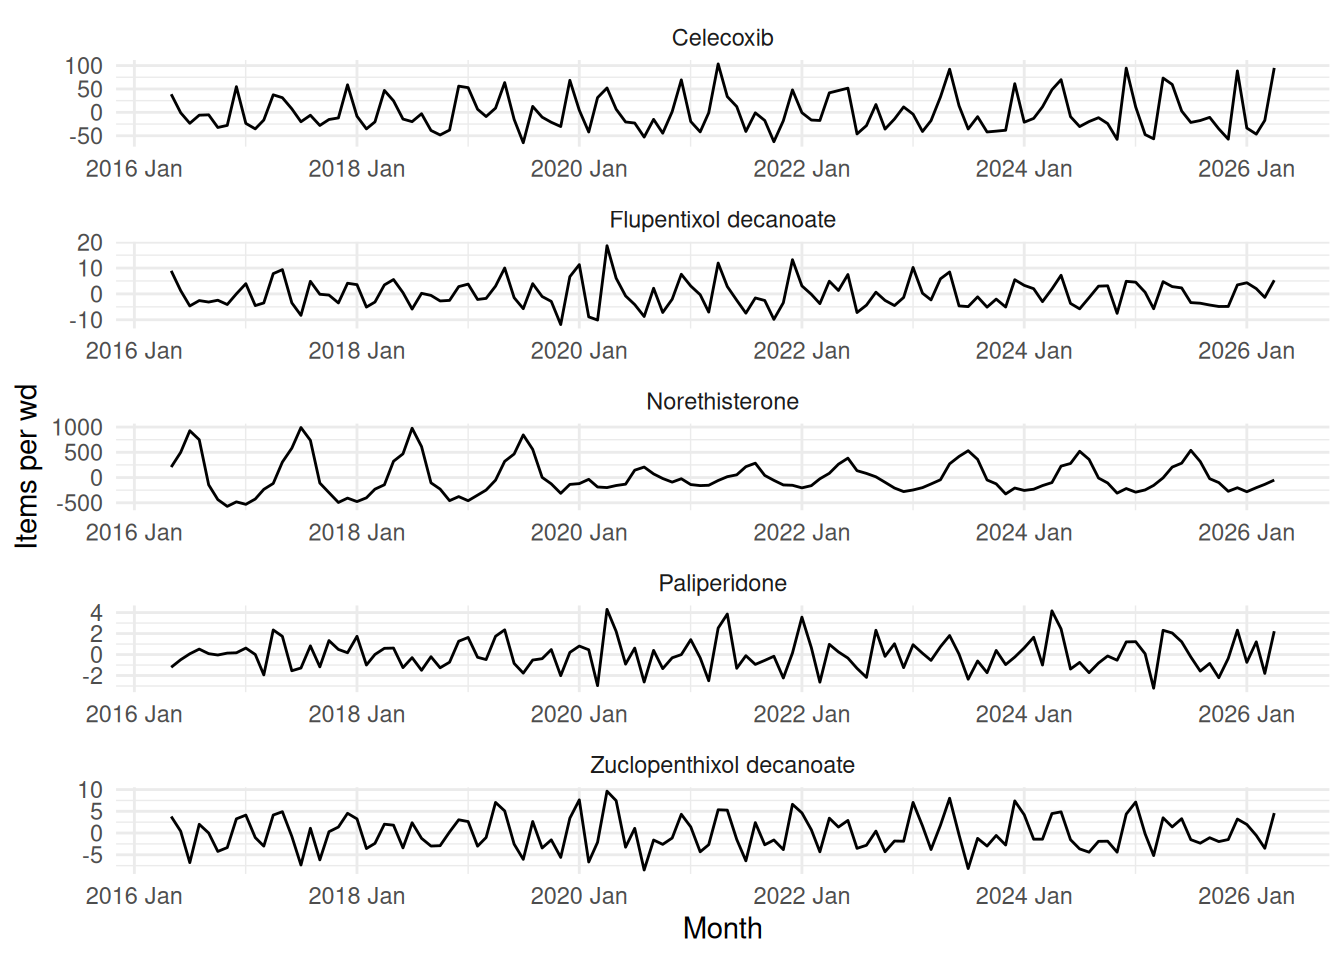
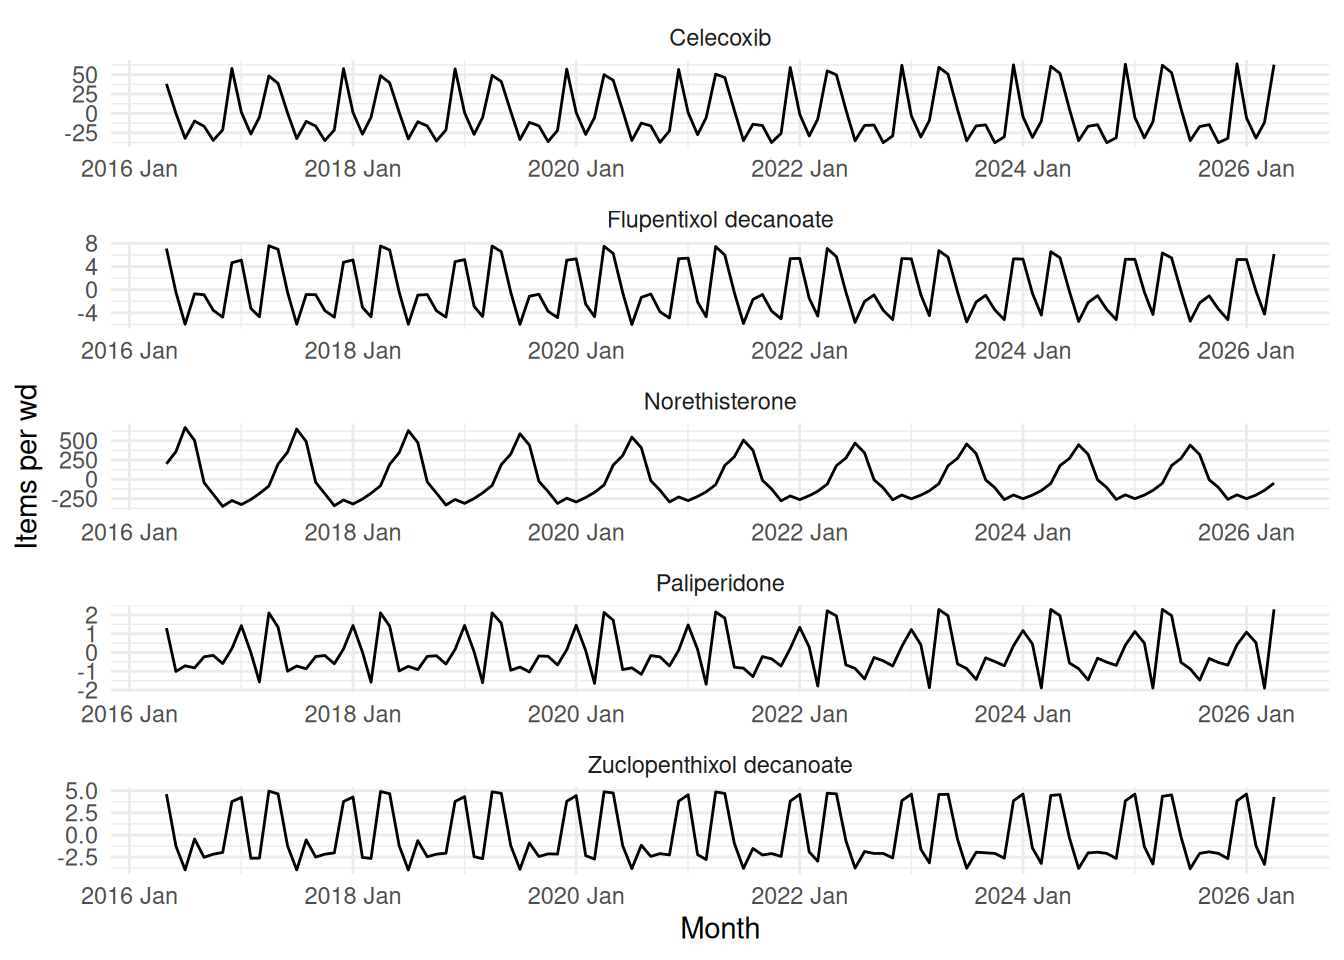
FFT
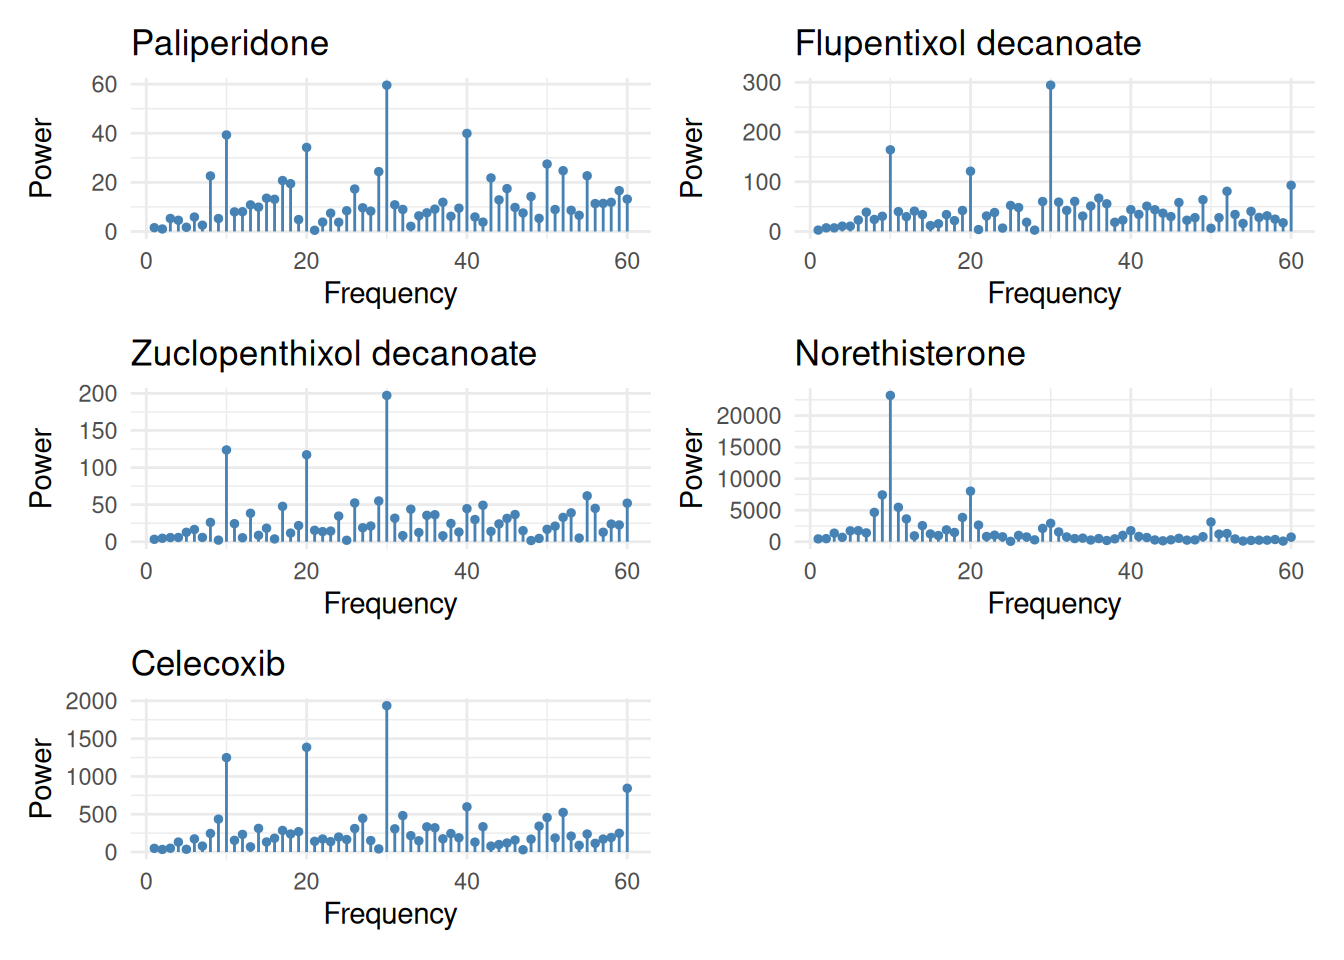
Candidate periods
| chemical | period_1 | freq_1 | score_1 | period_2 | freq_2 | score_2 | period_3 | freq_3 | score_3 | period_4 | freq_4 | score_4 | period_5 | freq_5 | score_5 |
|---|---|---|---|---|---|---|---|---|---|---|---|---|---|---|---|
| Paliperidone | 4 | 30 | 59.56743 | 3 | 40 | 39.9168 | 12.00 | 10 | 39.29698 | 6.00 | 20 | 34.21797 | 2.40 | 50 | 27.45449 |
| Flupentixol decanoate | 4 | 30 | 294.28234 | 12 | 10 | 164.2512 | 6.00 | 20 | 121.18716 | 2.00 | 60 | 92.83568 | 2.31 | 52 | 80.87959 |
| Zuclopenthixol decanoate | 4 | 30 | 197.23268 | 12 | 10 | 123.7118 | 6.00 | 20 | 117.23683 | 2.18 | 55 | 61.89077 | 4.14 | 29 | 54.97151 |
| Norethisterone | 12 | 10 | 23194.63746 | 6 | 20 | 8021.6854 | 13.33 | 9 | 7423.78295 | 10.91 | 11 | 5458.79771 | 15.00 | 8 | 4651.39100 |
| Celecoxib | 4 | 30 | 1936.41816 | 6 | 20 | 1385.6300 | 12.00 | 10 | 1249.23184 | 2.00 | 60 | 843.18365 | 3.00 | 40 | 597.45056 |
Modelling
| .model | period | k | lrt_stat | p_value | sigma2 | log_lik | AIC | AICc | BIC |
|---|---|---|---|---|---|---|---|---|---|
| 0402020AB - Paliperidone | |||||||||
| P4_K1 | 4 | 1 | 27.700559 | 9.7e-07 | 2.391055 | -219.1460 | 448.2920 | 448.8230 | 462.1877 |
| P3_K1 | 3 | 1 | 11.513941 | 0.0032 | 2.736643 | -227.2393 | 464.4787 | 465.0096 | 478.3743 |
| K0 | NA | 0 | NA | - | 2.961014 | -232.9963 | 471.9926 | 472.2013 | 480.3300 |
| 0402020G0 - Flupentixol decanoate | |||||||||
| P12_K3 | 12 | 3 | 25.212966 | 3.4e-06 | 14.846030 | -325.4144 | 670.8287 | 672.8658 | 698.6200 |
| P4_K1 | 4 | 1 | 40.693760 | 1.5e-09 | 21.334356 | -349.6704 | 709.3408 | 709.8718 | 723.2365 |
| P12_K2 | 12 | 2 | 26.024505 | 2.2e-06 | 18.142338 | -338.0208 | 696.0417 | 698.0787 | 723.8329 |
| 0402020Z0 - Zuclopenthixol decanoate | |||||||||
| P12_K3 | 12 | 3 | 27.332440 | 1.2e-06 | 7.640407 | -285.9388 | 591.8776 | 593.9146 | 619.6688 |
| P12_K2 | 12 | 2 | 33.056632 | 6.6e-08 | 9.523037 | -299.6050 | 619.2100 | 621.2471 | 647.0013 |
| P4_K1 | 4 | 1 | 37.166717 | 8.5e-09 | 11.648440 | -313.4401 | 638.8801 | 639.6301 | 655.5549 |
| 0604012P0 - Norethisterone | |||||||||
| P12_K2 | 12 | 2 | 38.775655 | 3.8e-09 | 22698.989546 | -761.6759 | 1545.3518 | 1547.8191 | 1575.9222 |
| P12_K1 | 12 | 1 | 13.057461 | 0.0015 | 30566.889735 | -781.0637 | 1574.1275 | 1574.8775 | 1590.8022 |
| K0 | NA | 0 | NA | - | 33926.014716 | -787.5925 | 1589.1849 | 1590.1939 | 1608.6388 |
| 1001010AH - Celecoxib | |||||||||
| P12_K4 | 12 | 4 | 9.929482 | 0.0070 | 751.754022 | -557.4791 | 1138.9583 | 1141.9017 | 1172.3078 |
| P12_K3 | 12 | 3 | 19.190416 | 6.8e-05 | 801.734774 | -562.4439 | 1144.8878 | 1146.9248 | 1172.6790 |
| P12_K2 | 12 | 2 | 53.697704 | 2.2e-12 | 934.440728 | -572.0391 | 1166.0782 | 1168.5455 | 1196.6485 |
Summary report
| Seasonality Detection Summary | |||||||
| Data period: 2016-05-01 to 2026-04-01 | Detrending: stl | |||||||
| Chemical | Dominant periods (FFT) | Model periods | Peak month | Trough month | Seasonal strength | Best model | LRT p-value |
|---|---|---|---|---|---|---|---|
| Celecoxib | 4, 6, 12 | 12, 6, 4, 3 | May | Nov | 0.77 | P12_K4 (P=12, K=4) | 0.0070 |
| Flupentixol decanoate | 4, 12, 6 | 12, 6, 4 | May | Aug | 0.68 | P12_K3 (P=12, K=3) | 3.4e-06 |
| Norethisterone | 12, 6, 13.3 | 12, 6 | Aug | Dec | 0.84 | P12_K2 (P=12, K=2) | 3.8e-09 |
| Paliperidone | 4, 3, 12 | 4 | May | Apr | 0.59 | P4_K1 (P=4, K=1) | 9.7e-07 |
| Zuclopenthixol decanoate | 4, 12, 6 | 12, 6, 4 | May | Aug | 0.68 | P12_K3 (P=12, K=3) | 1.2e-06 |
| Dominant periods from FFT (strongest amplitudes), shown independently as a sanity check. Model periods are the harmonic components (period/1, period/2, ...) actually retained in the BIC-selected model. Peak/Trough months are the calendar months with highest/lowest average dispensing. Best model from ARIMA errors + Fourier terms, selected by BIC. Seasonal strength from STL decomposition. | |||||||