Note: This guide is for illustration purposes only and may contain errors. It demonstrates example usage of the dataset and functions, but results should not be interpreted as validated analyses.
This example demonstrates how to explore annual NHS Talking Therapies
PROMS (Patient Reported Outcome Measures) data using the
nhstt package. We’ll look at effect sizes for depression
treatment across selected therapy types to illustrate the basic workflow
for accessing and visualising this publicly available data.
Setup
We start by loading the necessary packages and downloading the annual
PROMS dataset with get_proms_annual(). This report contains
clinical outcome measures including PHQ-9, GAD-7, and WSAS scores for
NHS Talking Therapies services across England.
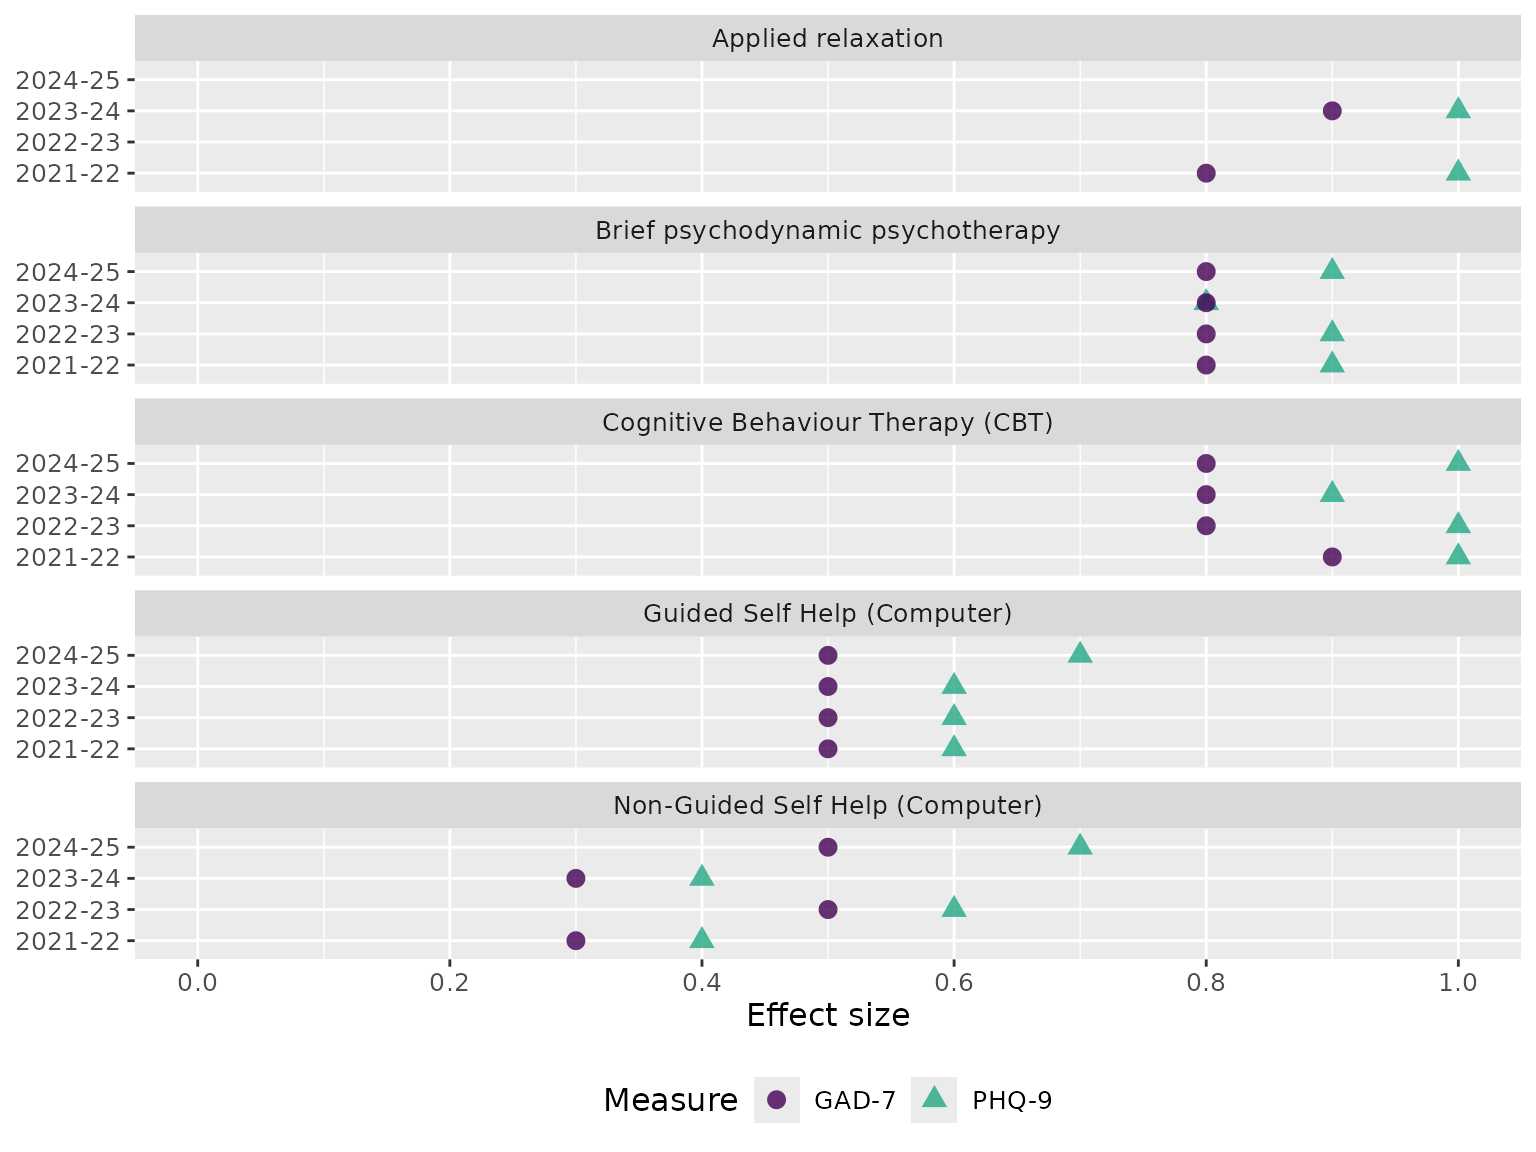
Select data for analysis
Here we filter the data to focus on effect sizes for GAD-7 and PHQ-9 measures at the national England level for depression, selecting six specific therapy types: applied relaxation, CBT, collaborative care, brief psychodynamic psychotherapy, and computer-based guided and non-guided self-help. This step requires careful exploration of the underlying data structure.
selected_proms <- proms |>
  filter(org_type == "England") |>
  filter(!org_name == "UNKNOWN") |>
  filter(variable_a == "Depression") |>
  filter(
    variable_b %in%
      c(
        "Applied relaxation",
        "Cognitive Behaviour Therapy (CBT)",
        "Collaborative Care",
        "Brief psychodynamic psychotherapy",
        "Guided Self Help (Computer)",
        "Non-Guided Self Help (Computer)"
      )
  ) |>
  filter(measure_name %in% c("phq", "gad")) |>
  filter(measure_statistic %in% c("effect_size")) |>
  mutate(
    measure_name = factor(
      measure_name,
      levels = c("gad", "phq"),
      labels = c("GAD-7", "PHQ-9")
    ),
    measure_statistic = factor(
      measure_statistic,
      levels = c("effect_size"),
      labels = c("Effect size")
    )
  )