Exploring monthly changes in treatment end codes
Source:vignettes/how-to-activity-performance-monthly.Rmd
how-to-activity-performance-monthly.RmdThis vignette provides the complete R code used to reproduce the analyses in our blog post: From public NHS Talking Therapies reports to research insights: Introducing the nhstt R package.
In a previous blog post we introduced the NHS TT data reports that NHS England publishes openly alongside interactive dashboards for exploring key measures directly in a browser. These datasets cover various measures, including referral activity, waiting times, clinical outcomes, and patient-reported outcome measures. The value of this publicly available data has been demonstrated by Clark et al. (2018), who used the annual publicly available NHS TT reports to study between-service variation in clinical outcomes. They found that organisational factors including waiting times, missed appointments, and the proportion of patients receiving a course of treatment were associated with rates of reliable recovery and improvement. This illustrates the broader role of public reporting in supporting transparency, benchmarking, and research on variation in routine psychological therapy services (Clark et al. 2018; Clark 2018). The monthly data, which is less commonly used for research than the annual reports, complements the annual publications by providing more timely signals for monitoring service activity and identifying measures or periods that warrant closer investigation.
The nhstt R package is built on top of these publicly available datasets and designed to complement the existing tools and dashboards. It provides an additional point of access to the same data in a tidy, analysis-ready format across all available reporting periods. In this vignette we use treatment end codes from the monthly activity and performance data as a worked example, but the same approach applies to any of the monthly measures in the datasets. The examples are descriptive and intended to illustrate what can be done with the data, not to draw conclusions about individual services.
Treatment end codes
When a referral ends in the reporting period, NHS TT services record a reason using a standardised treatment end code. These codes group referral outcomes into three categories: (1) referred but not seen, (2) seen but not taken on for a course of treatment, and (3) seen and taken on for a course of treatment. In line with national reporting, a patient is deemed to have had a course of treatment in NHS Talking Therapies if they have had at least two clinical sessions (coded as ‘assessment and treatment’ and/or ‘treatment’) before discharge (National Collaborating Centre for Mental Health 2024). This vignette focuses on the end codes for referrals where patients were seen and taken on for a course of treatment, and captures the recorded reason their treatment ended.
The monthly dataset includes counts for each end code, available from January 2021 to May 2026. The table below shows the five end codes for referrals seen and taken on for a course of treatment, together with M076, which counts the total number of referrals that finished a course of treatment and serves as the denominator when calculating proportions. Total recorded events and the number of services contributing data are shown for each measure. The four most commonly recorded end codes are used in the figures below; the Deceased end code (M069) is recorded in too few referrals to visualise. All monthly measures implemented in the nhstt R package can be explored online.
| ID | Description | Total events | NHS TT services |
|---|---|---|---|
| Numerator: Treatment end codes (seen and taken on for a course of treatment) | |||
| M066 | Count of referrals with an end date in the reporting period - Improving Access to Psychological Therapies care spell end code is 'Mutually agreed completion of treatment’ | 1,941,090 | 119 |
| M069 | Count of referrals that ended in the reporting period with an end code of ‘Deceased (Seen and taken on for a course of treatment)’ | 340 | 10 |
| M070 | Count of referrals that ended in the reporting period with an end code of ‘Not Known (Seen and taken on for a course of treatment)’ | 66,595 | 60 |
| M341 | Count of referrals that ended in the reporting period with an end code of ‘Termination of treatment earlier than patient requested’ | 85,790 | 72 |
| M344 | Count of referrals that ended in the reporting period with an end code of ‘Termination of treatment earlier than Care Professional planned’ | 1,112,000 | 114 |
| Denominator: Referrals that finished a course of treatment | |||
| M076 | Count of referrals with a discharge date in the period that had at least two treatment sessions (excluding follow up) | 3,610,860 | 183 |
Monthly trends and variation in treatment end codes
Across 65 reporting periods, these monthly data make it possible to look beyond annual totals and examine whether patterns in treatment end codes are stable or change over time.
Because services differ considerably in size, we present both raw counts and proportions relative to M076 (total referrals finishing a course of treatment). We first show service-level trends across all services, then use decile bands to place two example services in context.
Before presenting the results, we made two pragmatic data quality decisions for this vignette. First, we excluded 387 individual data points where the calculated proportion exceeded 100%, as these are not plausible and likely reflect recording or data quality issues. Second, we excluded 64 services with a median monthly M076 count below 20, or where any end code proportion was at or above 99% in at least one reporting period, as these patterns may be difficult to interpret reliably and require closer examination. These decisions were made to demonstrate how one might decide to work with this data and are not intended as a recommended analytical approach. In a research context, decisions about which services and data points to include or exclude should be guided by the specific research question. Where patterns in the monthly data appear unusual, cross-checking summed monthly values against the corresponding published annual report for the same period can help identify whether discrepancies reflect genuine recording differences or administrative timing effects such as delayed data entry.
Trends across all services
The figure below shows the monthly count of referrals recorded against each of the four end codes for referrals seen and taken on for a course of treatment, across all NHS TT services. Each line represents one service. The counts show variation in the absolute volume of referrals recorded against each end code across services and over time.
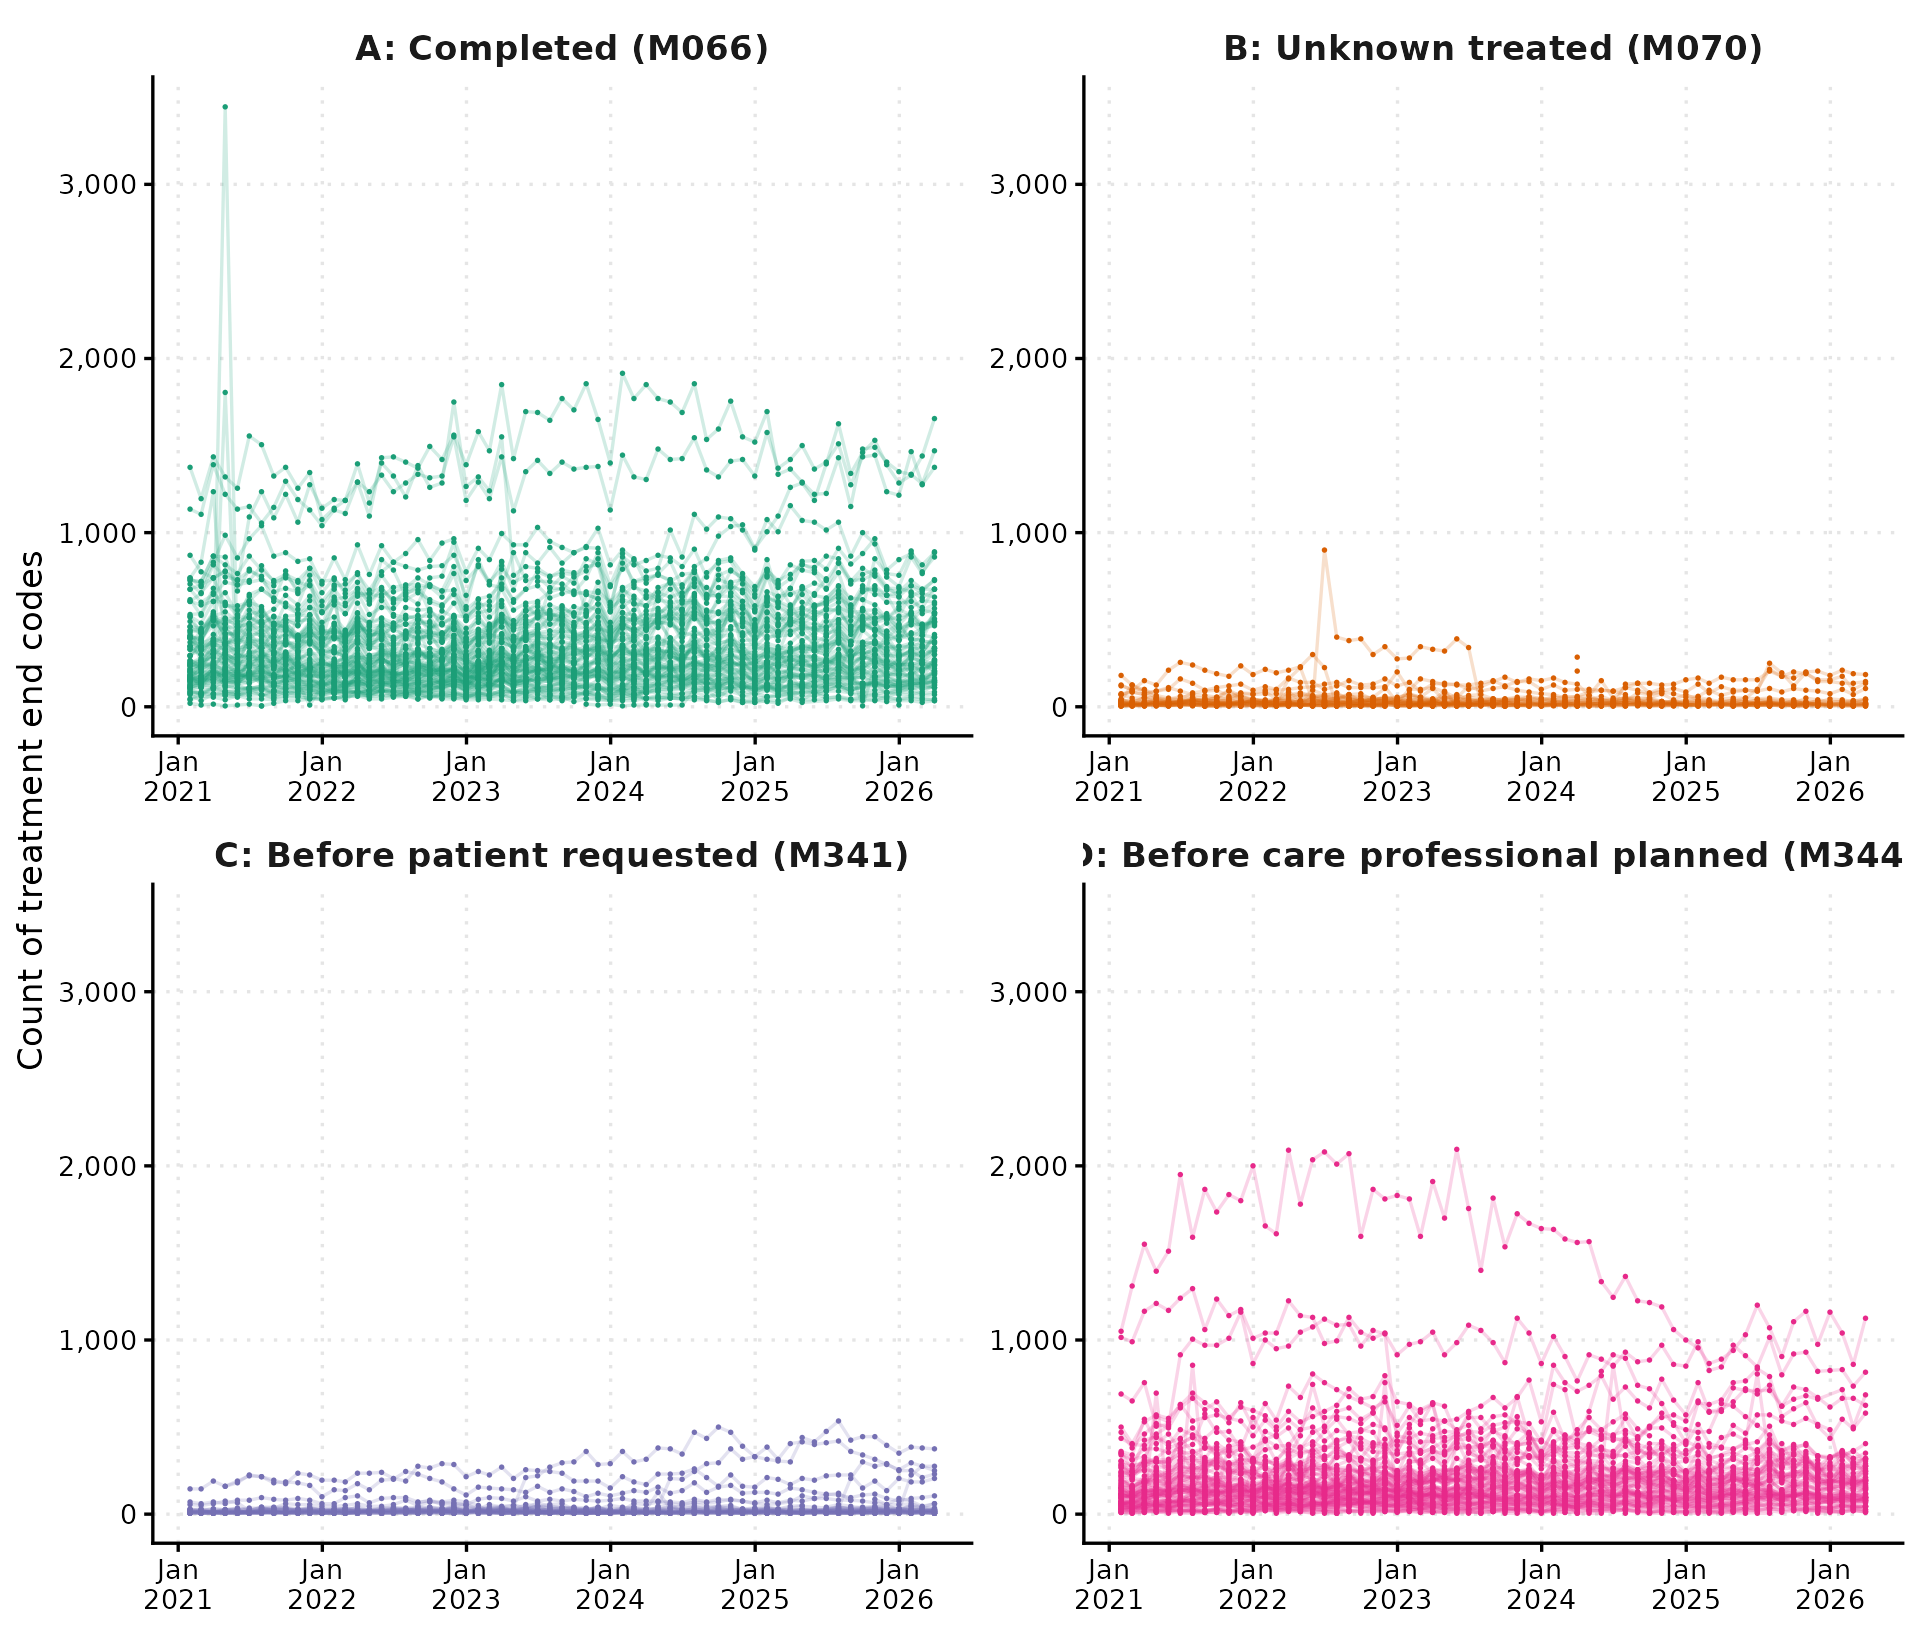
Monthly trends of individual NHS TT services in counts of treatment end codes for referrals seen and taken on for a course of treatment, for the four most commonly recorded end codes.
The figure below shows the same four end codes expressed as proportions of finished-course referrals (M076). Once service size is accounted for, most services fall within a broadly similar range for each end code and follow consistent trends across the reporting period. A small number of services stand out as consistent outliers in their proportions, particularly for Completed (M066; mutually agreed completion of treatment), Before care professional planned (M344), and Unknown treated (M070).
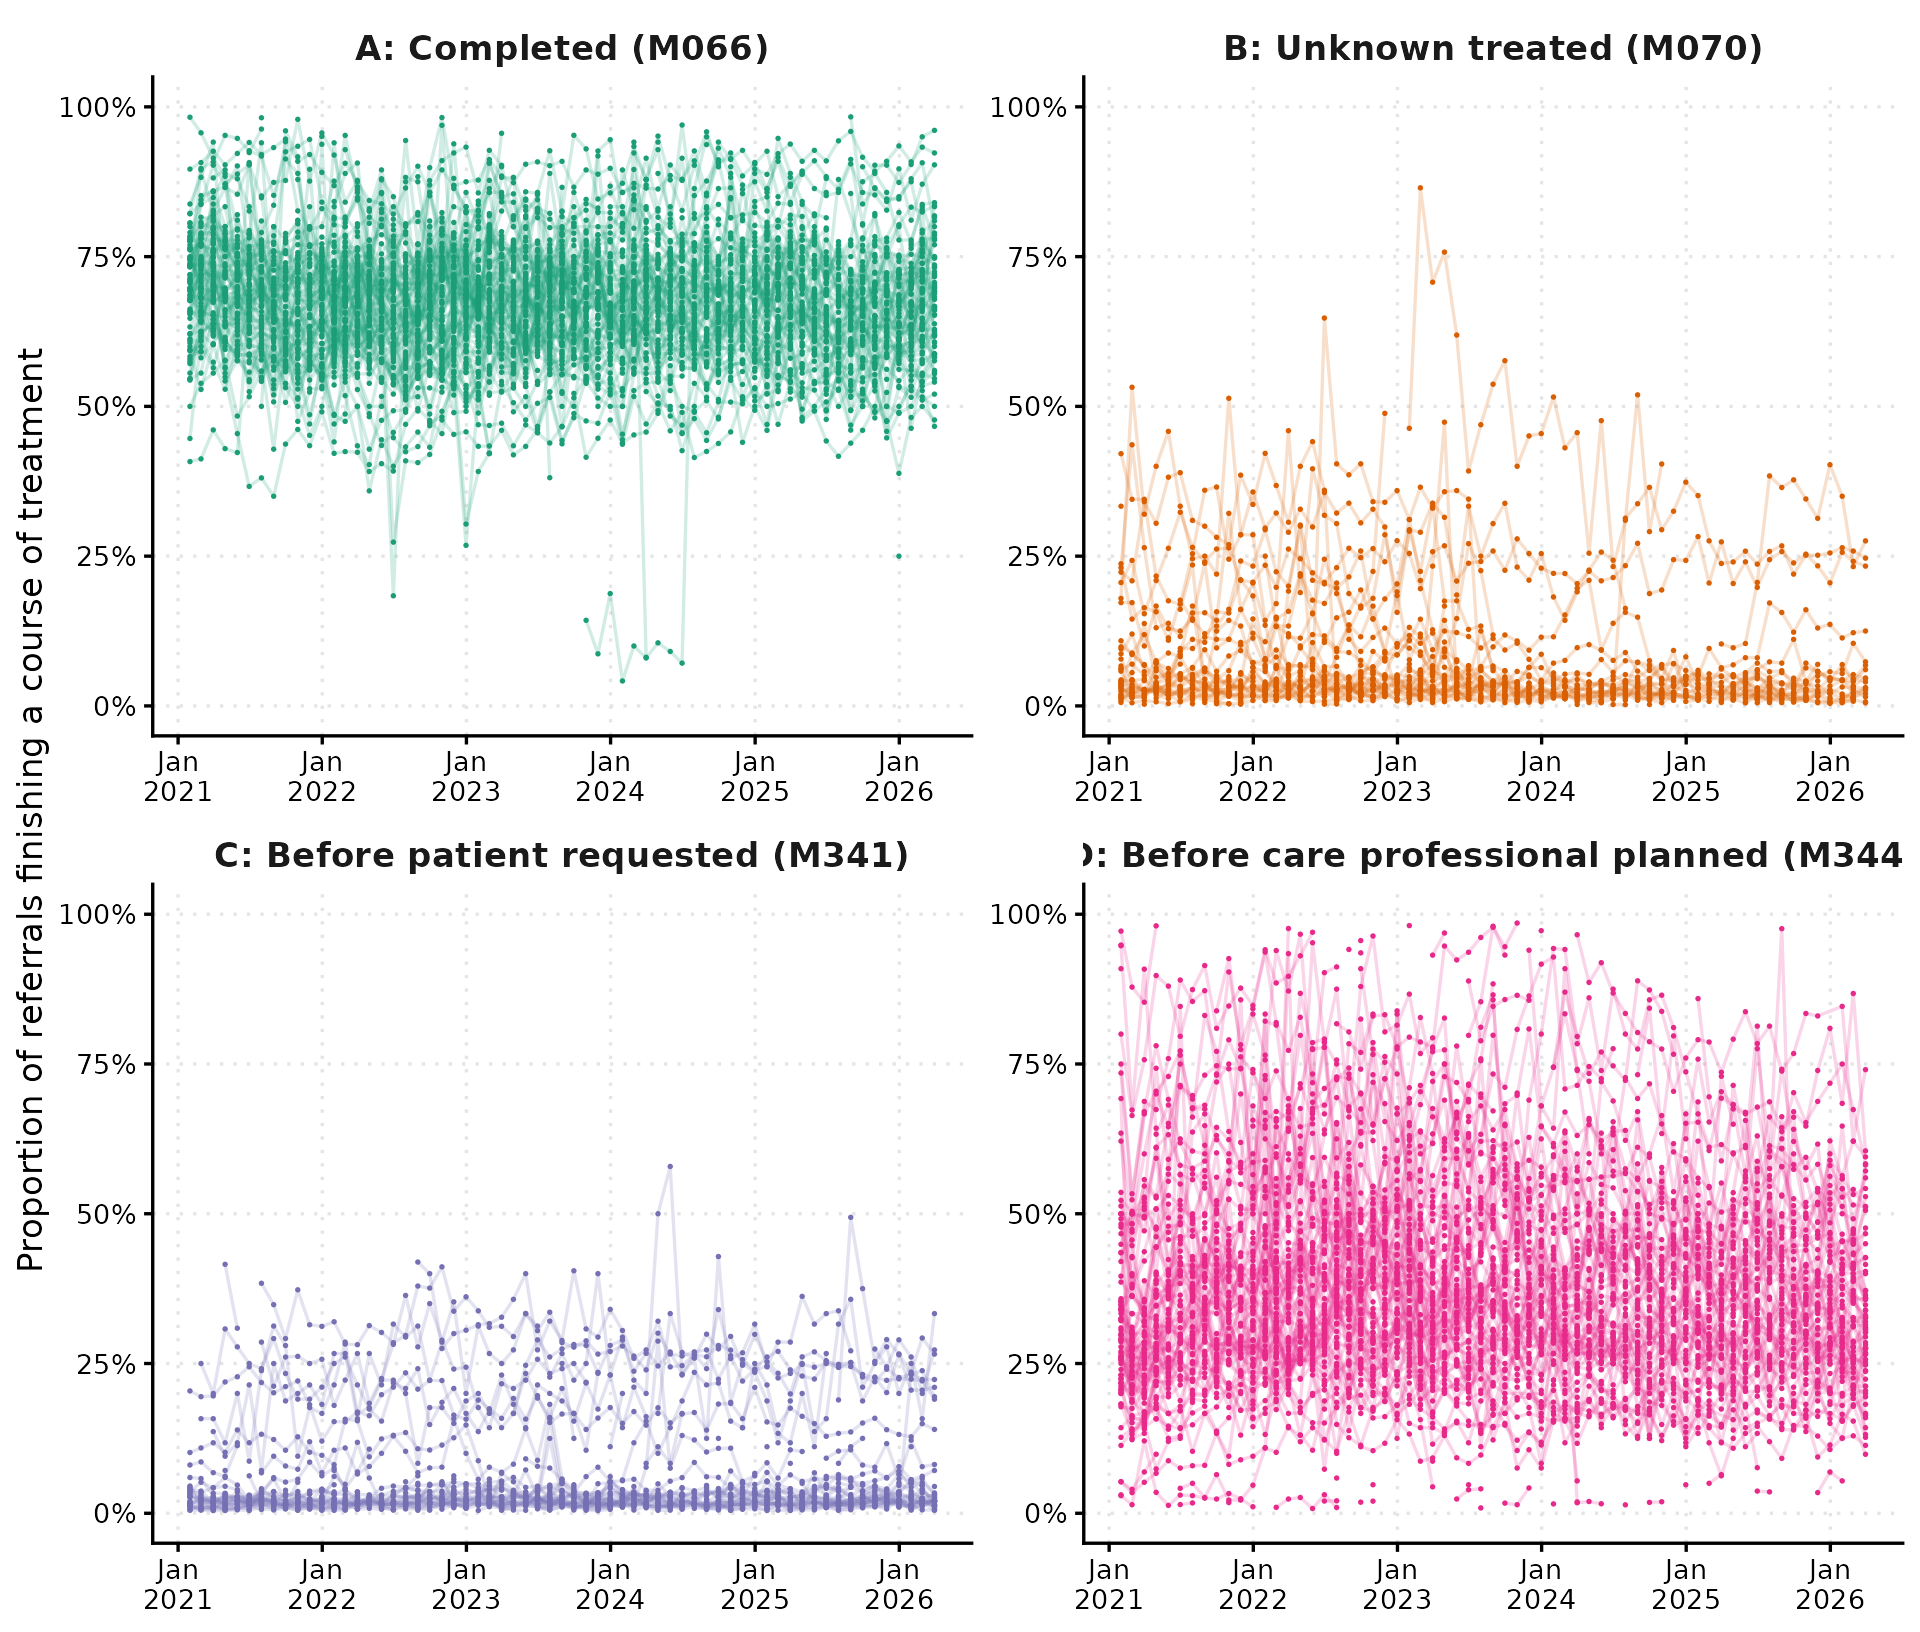
Monthly trends of individual NHS TT services in the proportion of finished-course referrals (M076) assigned each treatment end code for referrals seen and taken on for a course of treatment, for the four most commonly recorded end codes.
Comparing services with decile bands
The figure below uses decile bands to place the two example services in the context of the full distribution across all NHS TT services, expressed as proportions of finished-course referrals. Read more on why we think decile charts are a useful tool to communicate variation in a previous blog we wrote. The shaded bands show the distribution from the 10th to the 90th percentile in decile steps, with darker shading closer to the median. A service outside the bands falls in the top or bottom 10% for that month. The width of the bands reflects how much variation there is between services, with wider bands indicating greater spread. These charts summarise activity patterns and are not intended as rankings of service quality.
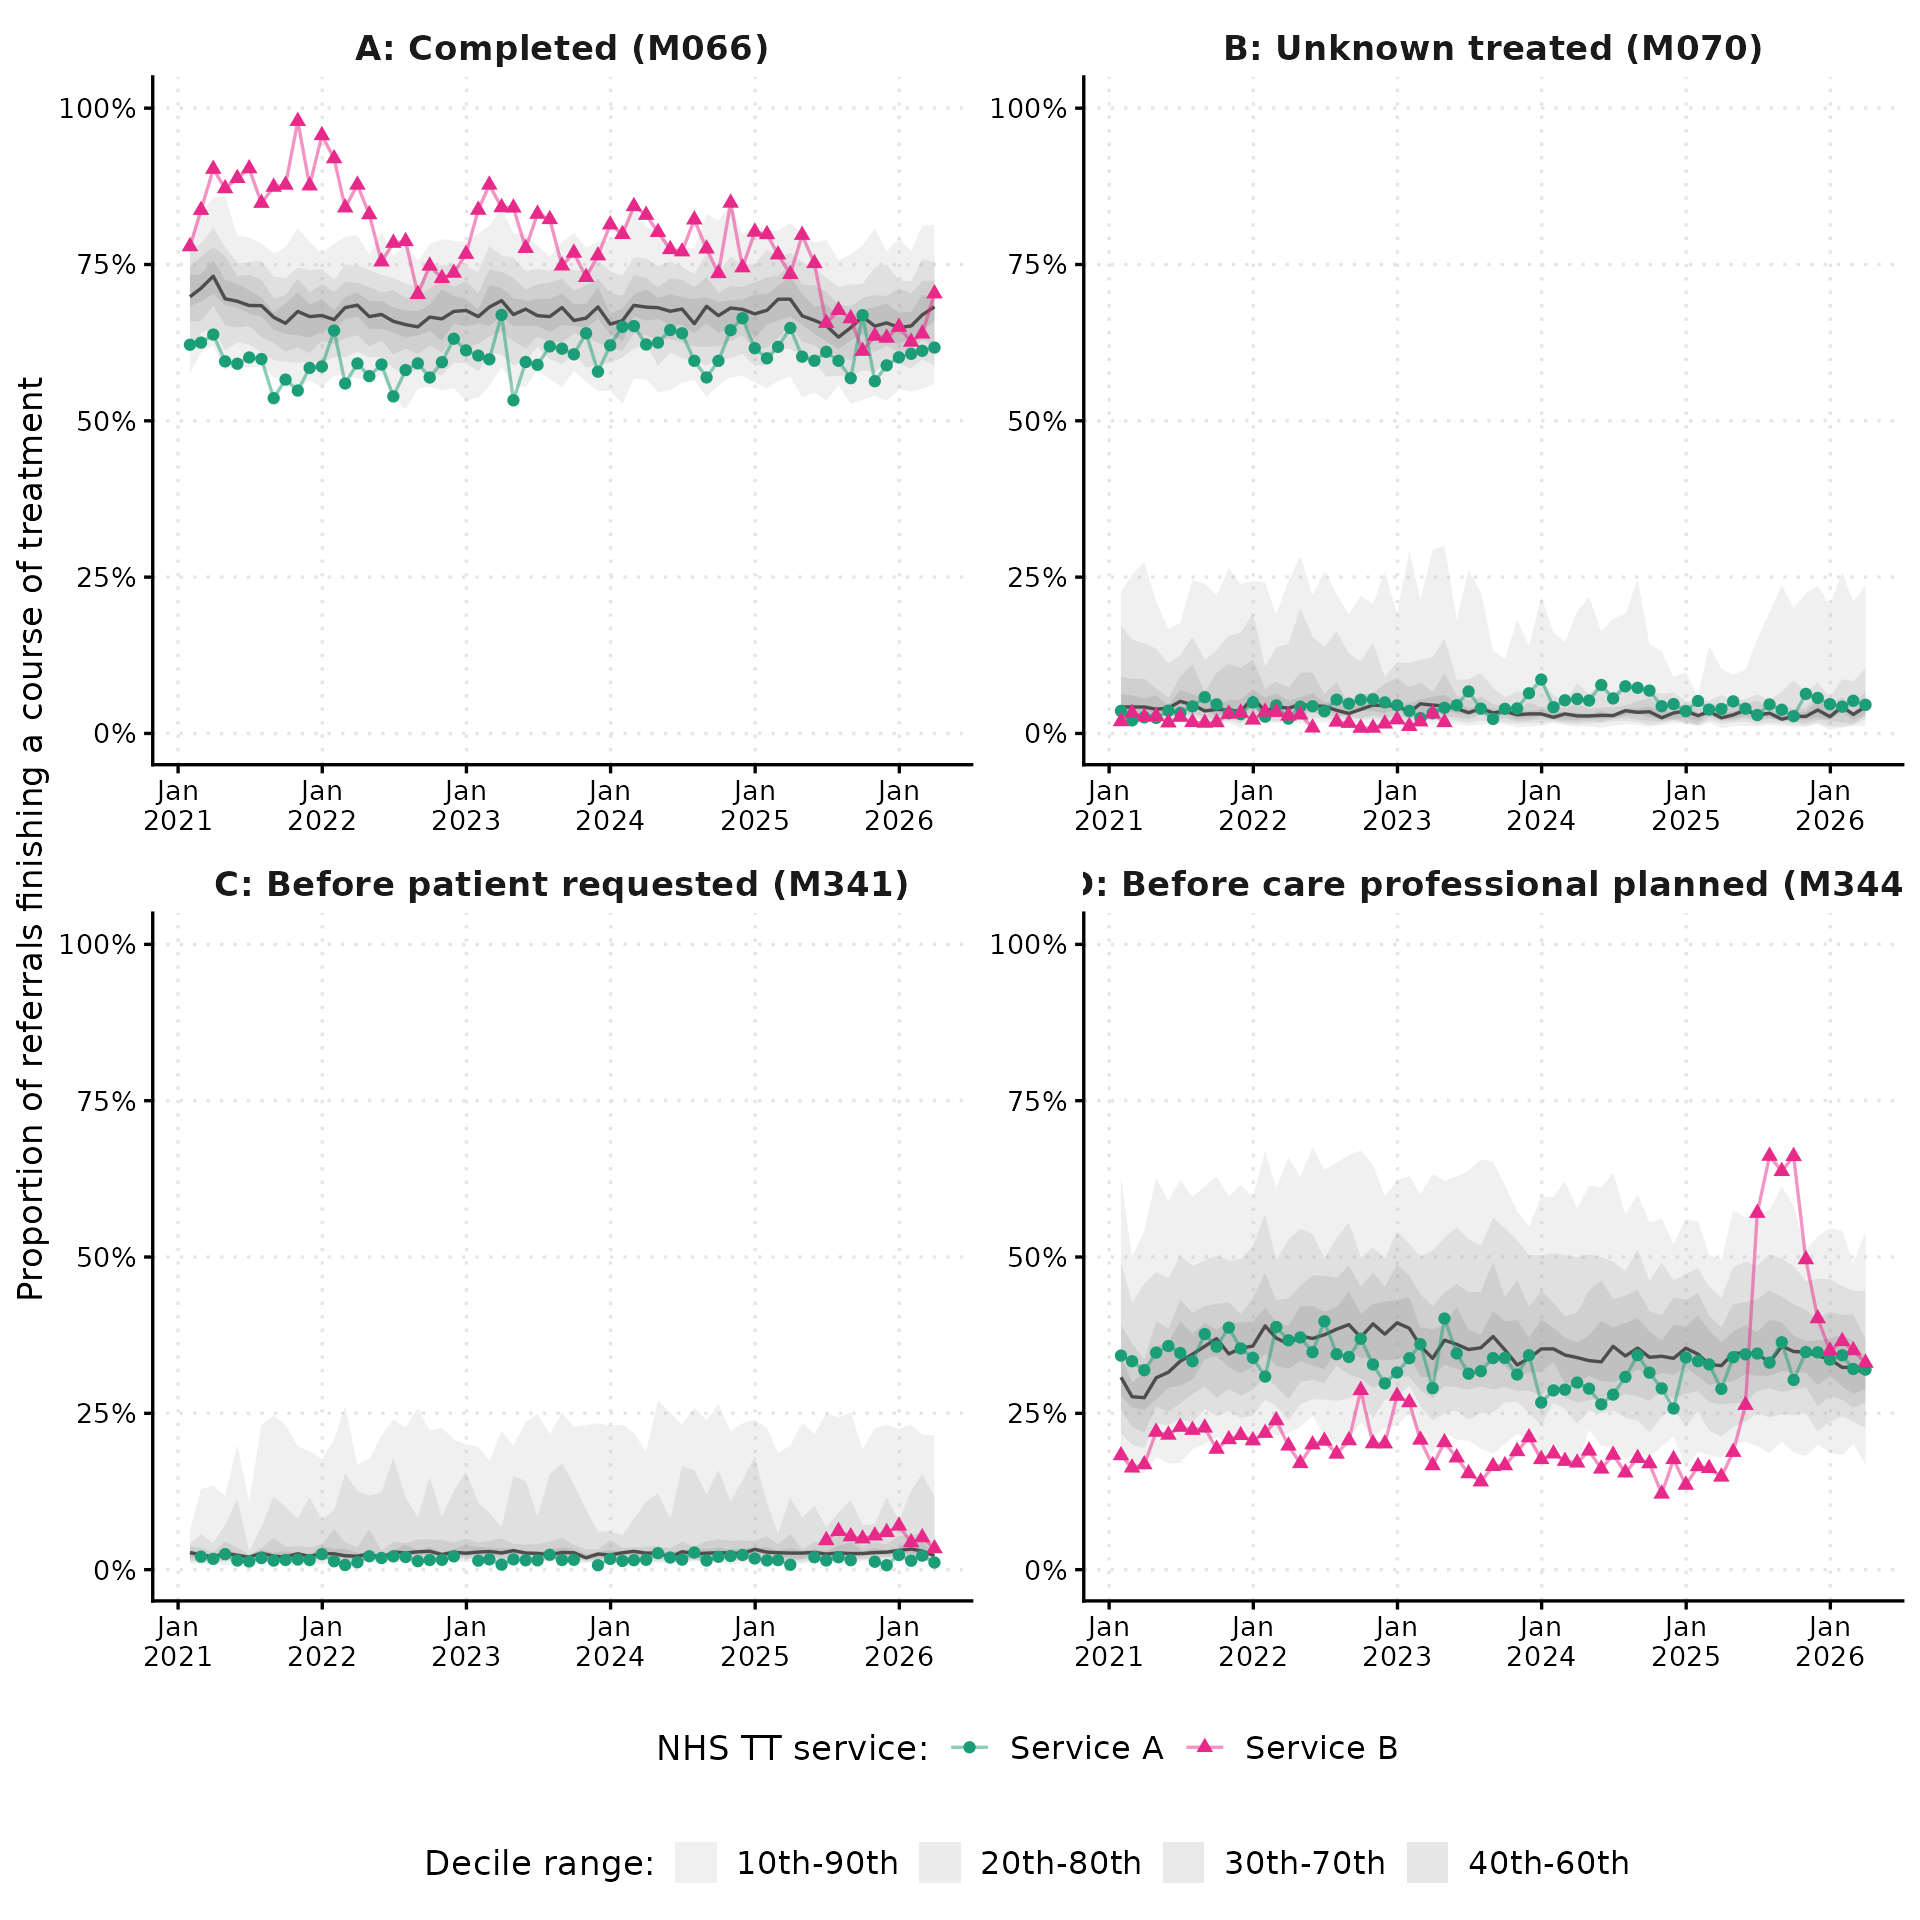
Decile charts showing overall variation and two example services for treatment end codes among referrals seen and taken on for a course of treatment, expressed as proportions of finished-course referrals (M076), for the four most commonly recorded end codes. Shaded bands show the 10th to 90th percentile range in decile steps. The dark line shows the median.
Each panel shows the proportion of finished-course referrals assigned one of the four treatment end codes. For the Completed end code (panel A), which records mutually agreed completion of treatment rather than all referrals finishing a course of treatment, Service A tracks below the median throughout, while Service B sits well above the median from 2021 onwards, at times in the top 10% of services, before falling to around the median from mid-2025. For the Unknown treated end code (panel B), Service A sits close to the median throughout. Service B only contributes data until early 2023, sitting slightly below the median while reporting. For the Before patient requested end code (panel C), Service A remains just below the median throughout. Service B only contributes data from mid-2025, sitting slightly above the median. For the Before care professional planned end code (panel D), Service A tracks close to the median throughout. Service B sits well below the median for most of the period, often in the bottom 10% of services, before a sharp rise peaking around 30 percentage points above the median between July and September 2025, after which it returns to around the median by the end of 2025.
Try it yourself
The nhstt package makes it easier to access publicly available NHS TT data, is free to use, and is updated regularly as NHS England publishes new reports. It provides access to each dataset in a tidy, analysis-ready format, with no need to find or clean the underlying files. Whether you are interested in trends in referral activity, variation in waiting times across services, or changes in clinical outcomes over time, the data is there to be explored. We recommend checking the NHS England data quality notes before using this data, as they describe known issues affecting specific reporting periods or measures.
If you use the package for a new analysis or have ideas for how it could be extended, we would love to hear about it. For questions or to report an issue, please open an issue on GitHub or get in touch with Milan Wiedemann.