How to use the annual key measures data
Source:vignettes/how-to-key-measures-annual.Rmd
how-to-key-measures-annual.RmdNote: This guide is for illustration purposes only and may contain errors. It demonstrates example usage of the dataset and functions, but results should not be interpreted as validated analyses.
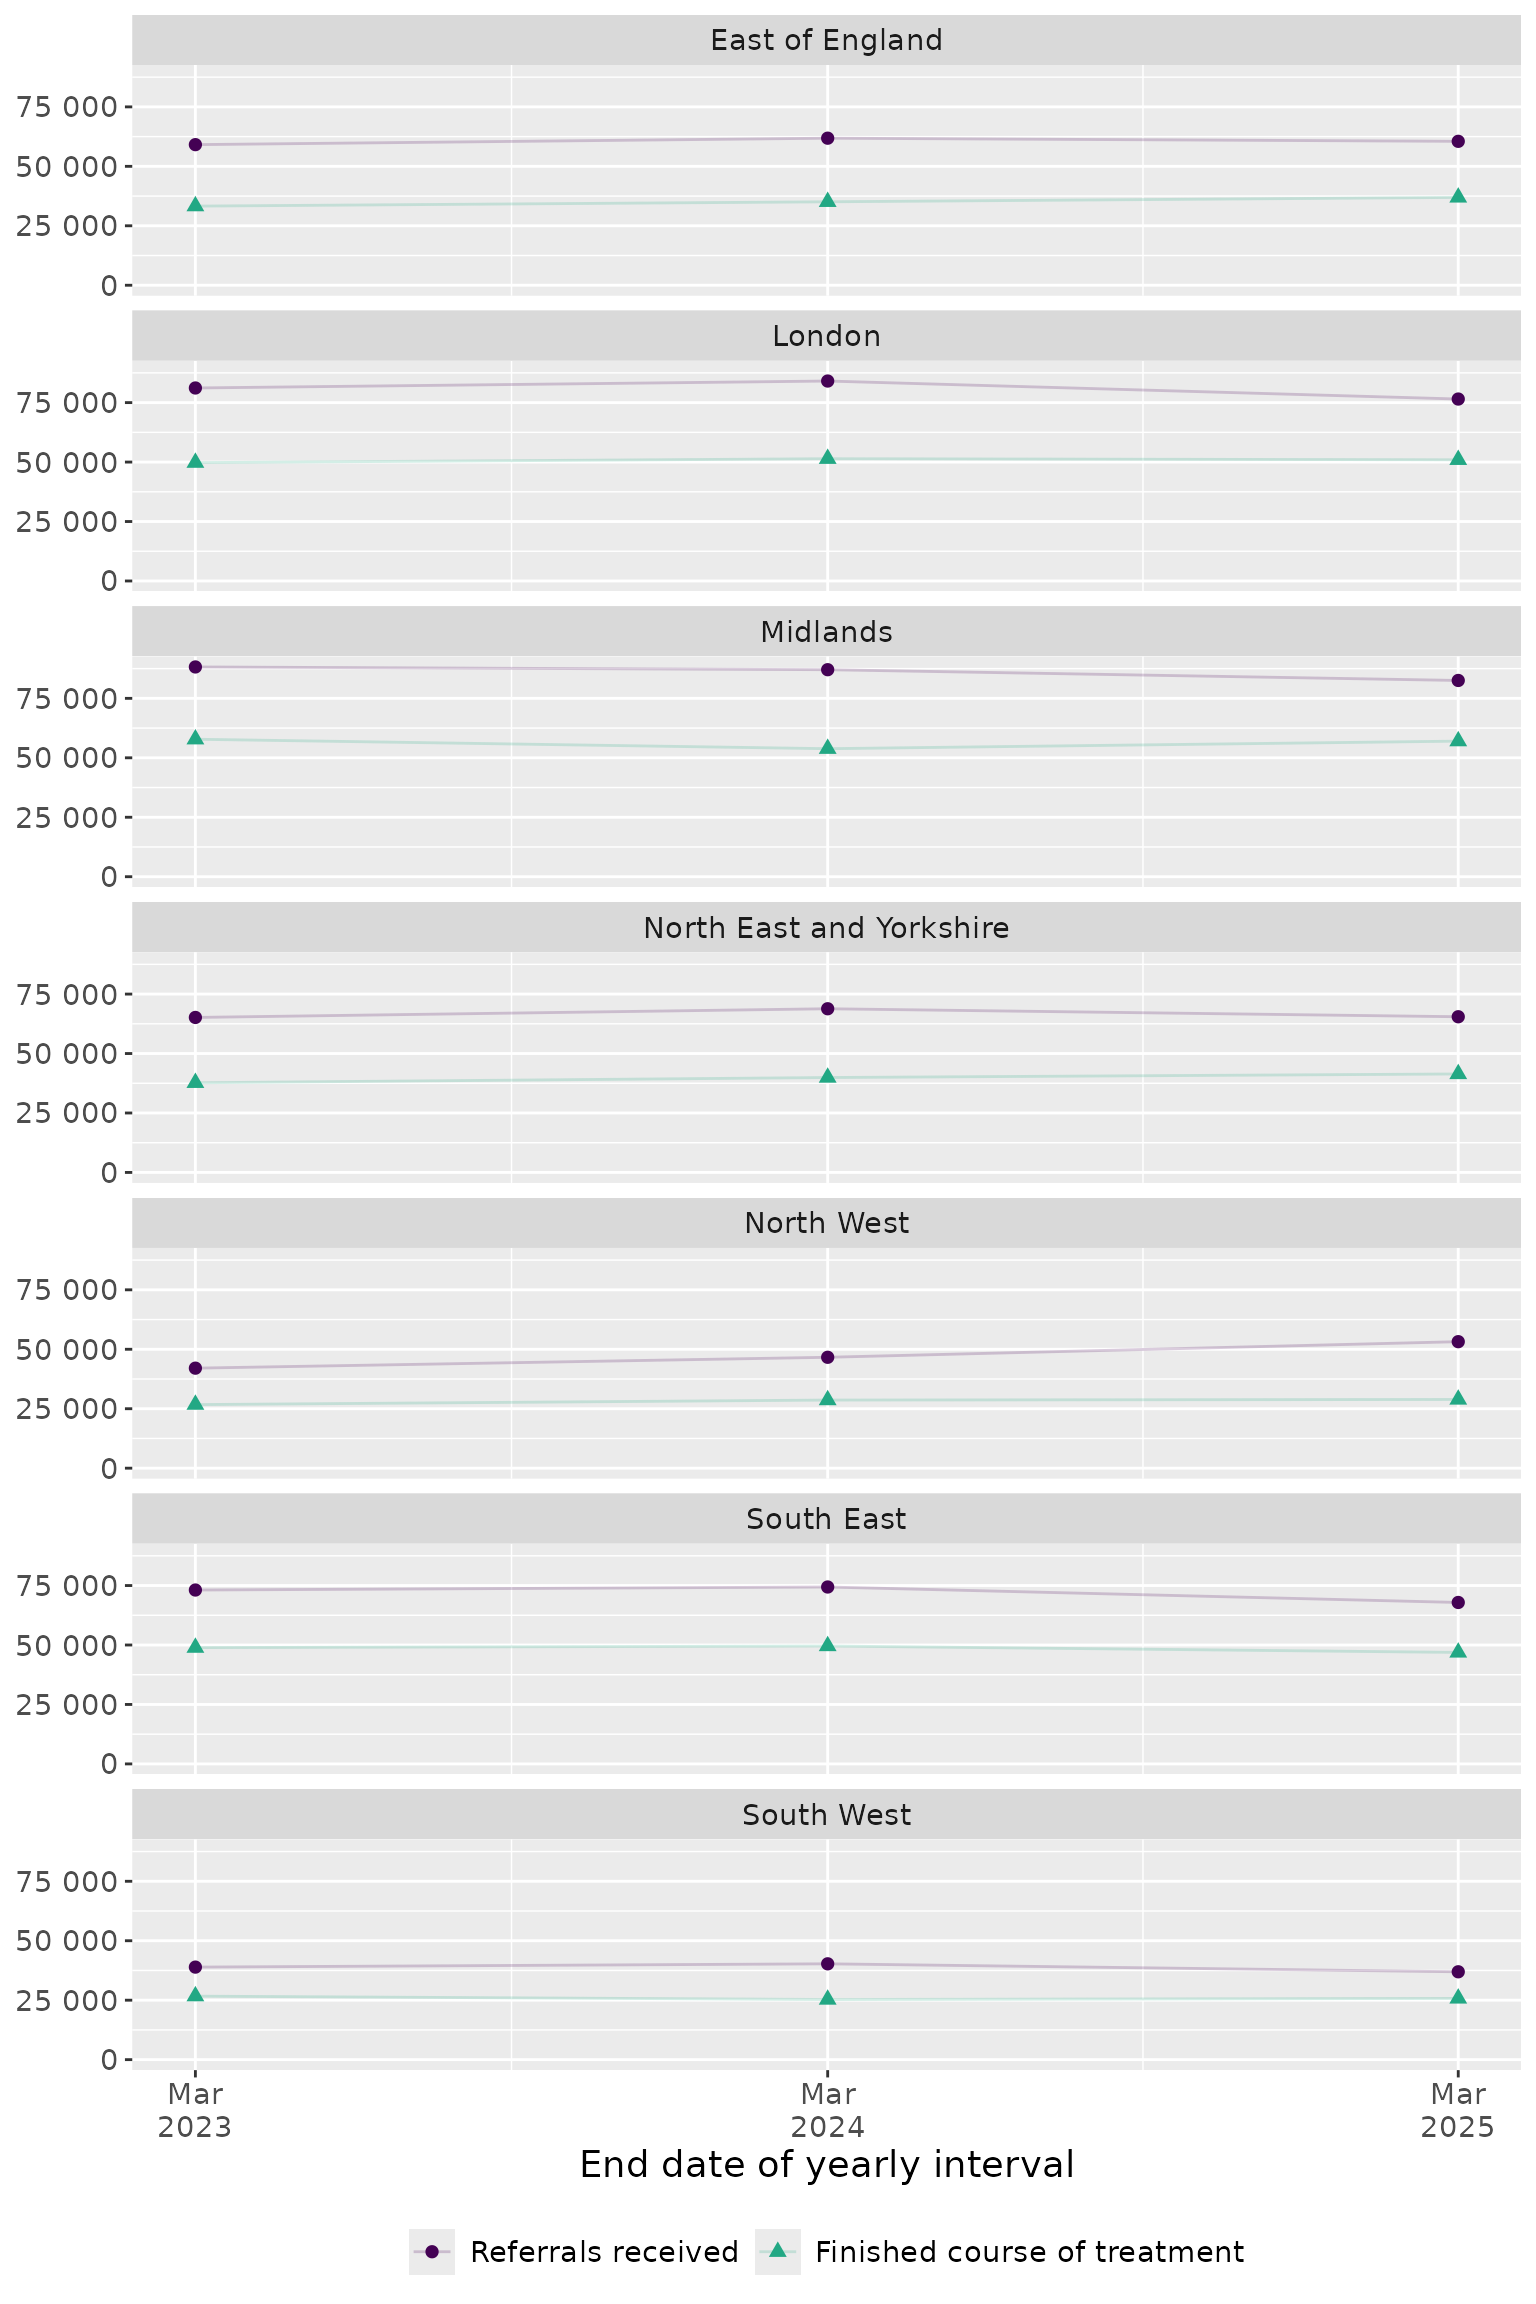
This example demonstrates how to explore annual NHS Talking Therapies
reports using the nhstt package. We’ll look at regional
trends in depression referrals and finished treatments to illustrate the
basic workflow for accessing and visualising this publicly available
data.
Setup
We start by loading the necessary packages and downloading the annual
key measures dataset with get_measures_annual(). This
report contains annual performance indicators for NHS Talking Therapies
services across England.
Select data for analysis
Here we filter the data to focus on received referrals and finished treatments at the regional level. This step requires careful exploration of the underlying data structure.
# Select data for analysis
selected_measures <- key_measures |>
  filter(org_type == "Commissioning Region") |>
  filter(!org_name == "UNKNOWN") |>
  filter(
    measure_name %in% c("referrals_received", "finished_course_treatment")
  ) |>
  filter(measure_statistic == "count") |>
  filter(variable_a == "Depression") |>
  select(
    start_date,
    end_date,
    org_name,
    variable_a,
    measure_statistic,
    measure_name,
    value
  )

# Tidy data for analysis
selected_measures <- selected_measures |>
  mutate(
    org_name = str_to_title(str_remove(org_name, "\\s*COMMISSIONING REGION$")),
    org_name = str_replace_all(org_name, "\\b(Of|And)\\b", tolower),
    measure_name = factor(
      measure_name,
      levels = c("referrals_received", "finished_course_treatment"),
      labels = c("Referrals received", "Finished course of treatment")
    )
  )